Here they go again, blaming the wildfire catastrophe in Los Angeles on Climate Change when the actual culprits are the very politicians who never stop howling about what is a monumental hoax.
In the first place, of course, the current raging California fires, like those which have periodically gone before, are largely a function of misguided government policies. Officials have essentially curtailed the supply of water available to LA firefighters, even as they have drastically increased the supply of combustible kindling and vegetation which feeds these wildfires. The latter, in turn, are being amplified by the seasonal Santa Ana winds, which have visited the California coast since time immemorial.
The kindling at issue stems from forest management policies that prevent the removal of excess fuel via controlled burns, which are fires intentionally set by forest managers to reduce the buildup of hazardous fuels. As we amplify below, red tape and bureaucratic obstacles have frequently delayed or prevented these controlled burns, allowing brush, dead trees, and other flammable materials to accumulate excessively.
In this case, state and Federal politicians have simultaneously
curtailed the supply of water available to Los Angeles firefighters in order to protect so-called endangered species.
Specifically, southern California is being held hostage by sharp curtailment of the water pumping rates from the Sacramento-San Joaquin River Delta in order to protect the Delta Smelt and Chinook Salmon.
These former are shiny but tiny little buggers, as suggested by the handful of Smelt in the first picture below. But apparently, if they are protected, fished, and then fried up, they make for a certain kind of delicacy.
 Needless to say, California is entitled to stew in the foolishness of its own policies
—if that’s what its voters really want. But its self-imposed misery should not be an occasion for more howling in favor of Washington policies to fight climate change.
At least with respect to the latter, the Donald has his head screwed on right. And he does not hesitate to opine on the matter, which is all to the good of balancing what has otherwise been a wholly one-sided and utterly misleading Climate Crisis narrative. Naturally, the latter has been promulgated and peddled by statists because it provides yet one more big, scary, and urgent reason for an “all of government” campaign of more spending, borrowing, regulating, and the curtailing of free market enterprise and personal liberty.
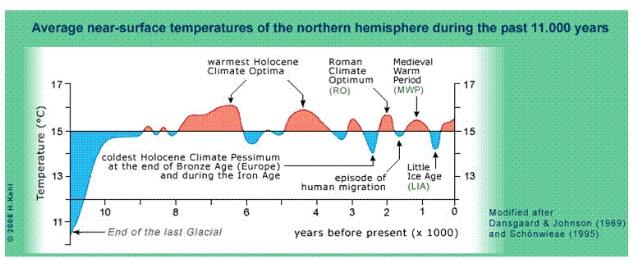
So let us once again review the bogus case for AGW or what is known as Anthropogenic Global Warming. And perforce it must start with the geological and paleontological evidence, which overwhelmingly says that today’s average global temperature of about 15 degrees C and CO2 concentrations of 420 ppm are nothing to fret about. And even if they rise to about 17-18 degrees C and 500-600 ppms, respectively, by the end of the century owing mainly to a natural warming cycle that has been underway since the end of the Little Ice Age (LIA) in 1850, it may well on balance improve the lot of mankind.
After all, bursts of civilization during the last 10,000 years uniformly occurred during the warmer red portion of the graph below. The great civilizations of the Yellow, Indus, Nile, and Tigris/Euphrates river valleys, the Minoan era, the Greco-Roman civilization, the Medieval flowering, and the industrial and technological revolutions of the present era all were enabled by periods of elevated temperatures. At the same time, the several lapses into “dark ages” happened when the climate turned colder (blue).
And that’s only logical. When it’s warmer and wetter, growing seasons are longer and crop yields are better—regardless of the agricultural technology and practices of the moment. And it’s better for human and community health, too—most of the deadly plagues of history have occurred under colder climes, such as the Black Death of 1344-1350.
Yet the Climate Crisis narrative deep-sixes this massive body of “the science” by means of two deceptive devices. Without them, the entire AGW story doesn’t have much of a leg to stand on.
 First, it ignores the entirety of the planet’s pre-Holocene (last 10,000 years) history,
 even though the science shows that more than 90% of the time in the last 600 million years global temperatures (blue line) and CO2 levels (black line) have been higher than at present; and that 50% of the time they were much higher—with temperatures in the range of
22 degrees C or 50
% higher than current levels.
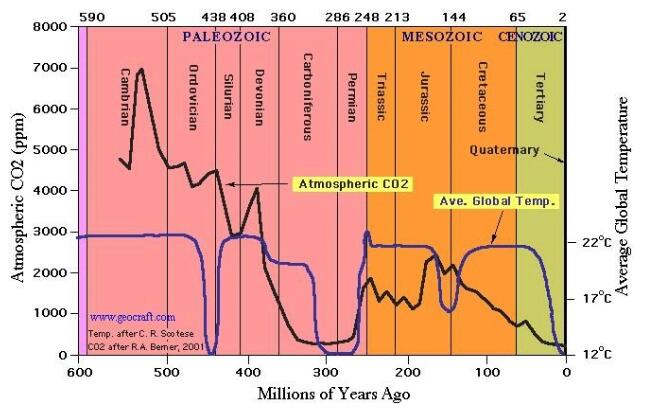
That’s far beyond anything projected by the most unhinged climate models today. But, crucially, the planetary climate systems did not go into a doomsday loop of ever increasing temperatures ending in a scorching meltdown. To the contrary, warming epochs were always checked and reversed by powerful countervailing forces.
Even the history the alarmists do acknowledge has been grotesquely falsified. As we have demonstrated elsewhere, the so-called “hockey stick” of the most recent 1,000 years in which temperatures were allegedly flat until 1850 and are now rising to supposedly dangerous levels is a complete crock. It was fraudulently manufactured by the IPCC (Intergovernmental Panel on Climate Change) to “cancel” the fact that temperatures in the pre-industrial world of the Medieval Warm Period (1000-1200 AD) were actually significantly higher than at present.
Secondly, it is falsely claimed that global warming is a one-way street in which rising concentrations of greenhouse gases (GHGs) and especially CO2 is causing the earth’s heat balance to continuously increase. The truth, however, is that higher CO2 concentrations are a
consequence and byproduct, not a driver and cause, of the current naturally rising (and falling) global temperature cycles.
Again, the now “canceled” history of Planet Earth knocks the CO2-forcing proposition into a cocked hat. During the Cretaceous Period between 145 and 66 million years (third orange panel) ago a natural experiment provided complete absolution for the vilified CO2 molecule. During that period, global temperatures rose dramatically from 17 degrees C to 25 degrees C—a level far above anything today’s Climate Howlers have ever projected.
Alas, CO2 wasn’t the culprit. According to the science, ambient CO2 concentrations actually tumbled during the 80 million years expanse of the Cretaceous, dropping from 2,000 ppm to 900 ppm on the eve of the Extinction Event 66 million years ago. So temperature and CO2 concentrations actually moved in the opposite directions. Big time.
You would think that this powerful countervailing fact would give the CO2 witch-hunters pause, but that would be to ignore what the whole climate change brouhaha is actually about. That is, it’s not about science, human health, and well-being, or the survival of Planet Earth; it’s about politics and the ceaseless search of politicians and statists for control of modern economic and social life. The resulting aggrandizement of state power, in turn, is mightily assisted by the Beltway political class and the apparatchiks and racketeers who gain power and pelf from the anti-fossil fuels campaign.
Indeed, the Climate Crisis narrative is the kind of ritualized policy mantra that has been concocted over and again by the political class and the permanent nomenklatura of the modern state—professors, think-tankers, lobbyists, career apparatchiks, officialdom—in order to gather and exercise state power.
To paraphrase the great Randolph Bourne, inventing purported failings of capitalism—such as a propensity to burn too much hydrocarbon—is the health of the state. Indeed, fabrication of false problems and threats that purportedly can only be solved by heavy-handed state intervention has become the modus operandi of a political class that has usurped near complete control of modern democracy.
So doing, however, the career political class and associated ruling elites have gotten used to such unimpeded success that they have become sloppy, superficial, careless, and dishonest. For instance, the minute we get a summer heat wave or an event like the current LA fires these natural weather events are jammed into the global warming narrative with nary a second thought by the lip-syncing journalists of the MSM.
Yet there is absolutely no scientific basis for all this tom-tom beating. For instance, on the related issue of heat waves and dry period wildfires, NOAA publishes a heat wave index. The latter is based on extended temperature spikes which last more than 4 days and which would be expected to occur only once every ten years based on the historical data.
As is evident from the chart below, the only true heat wave spikes we have had in the last 125 years were during the Dust Bowl heat waves of the 1930s. The frequency of mini-heat wave spikes since 1960 is actually no greater than it was during the 1895-1935 period.
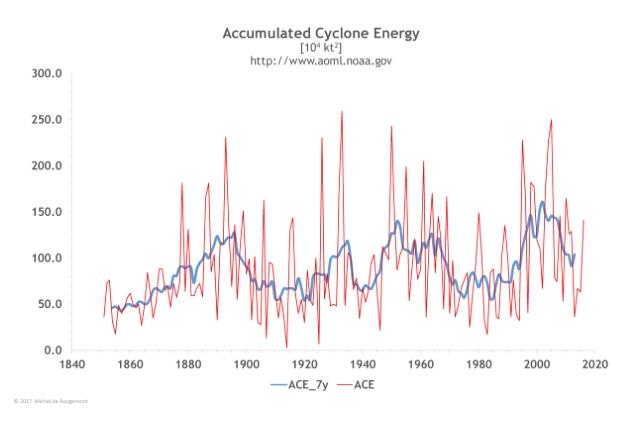
Likewise, all it takes is a good Cat 3 hurricane and they are off to the races, gumming loudly about AGW. Of course, this ignores entirely NOAA’s own data as summarized in what is known as the ACE (accumulated cyclone energy) index.
This index was first developed by the renowned hurricane expert and Colorado State University professor, William Gray. It uses a calculation of a tropical cyclone’s maximum sustained winds every six hours. The latter is then multiplied by itself to get the index value and accumulated for all storms for all regions to get an index value for the entire year. That’s shown below for the past 170 years (the blue line is the seven-year rolling average).
Your editor has an especially high regard for Professor Gray—not the least because he was roundly vilified by the very inexpert, Al Gore. But back in our private equity days, we invested in a Property-Cat company, which was in the super-hazardous business of insuring against the extreme layers of damage caused by very bad hurricanes and earthquakes. So setting the premiums correctly was no trifling business and it was the analytics, long-term databases, and current-year forecasts of Professor Gray upon which our underwriters crucially depended.
That is to say, hundreds of billions of insurance cover was then and still is being written with the ACE index as a crucial input. Yet if you examine the 7-year rolling average (blue line) in the chart, it is evident that ACE was as high (or higher) in the 1950s and 1960s as it is today, and that the same was true of the late 1930s and the 1880-1900 periods.
To be sure, the blue line is not flat as a board because there are natural short-term cycles, as amplified below, which drive the fluctuations shown in the chart. But
there is no “science” extractable from the chart that supports the alleged linkage between the current natural warming cycle and worsening hurricanes.
 The above is an aggregate index of all storms and is therefore as comprehensive a measure as exists.
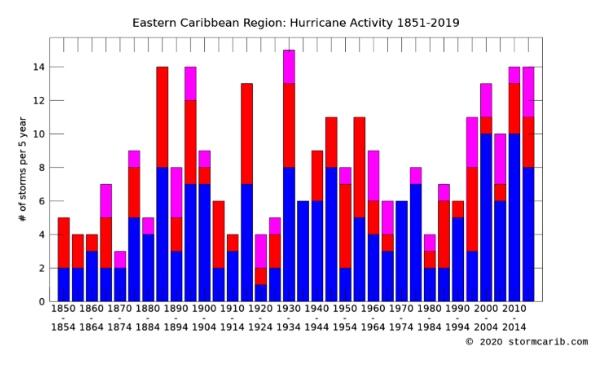
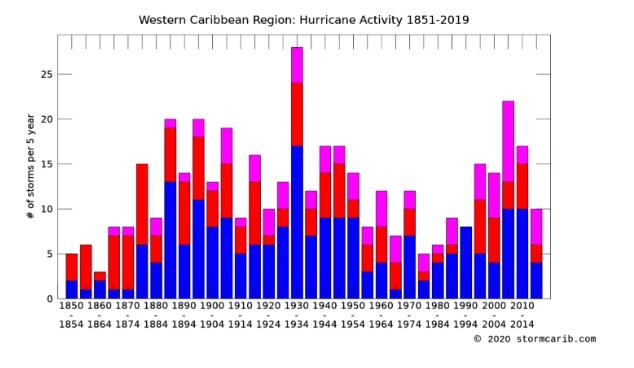
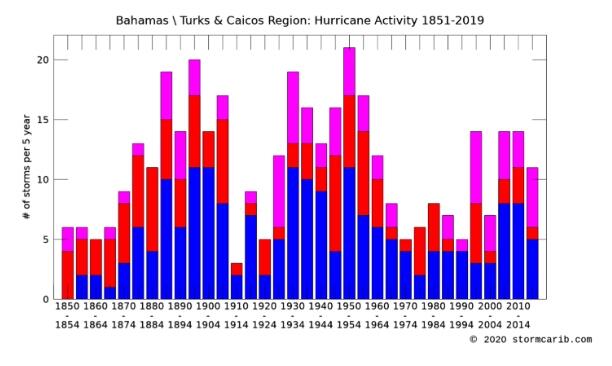
 But for want of doubt, the next three panels look at hurricane data at the individual storm count level. The pink portion of the bars represent the number of big, dangerous Cat 3-5 storms, while the red portion reflects the number of lesser Cat 1-2 storms and the blue area the number of tropical storms that did not reach Cat 1 intensity.
The bars accumulate the number of storms in 5-year intervals and reflect recorded activity back to 1851. The reason we present three panels—for the Eastern Caribbean, Western Caribbean, and Bahamas/Turks and Caicos, respectively, is that the trends in these three sub-regions clearly diverge. And that’s actually the smoking gun.
If global warming was generating more hurricanes as the MSM constantly maintains, the increase would be uniform across all of these sub-regions, but it’s clearly not. Since the year 2000, for example,
- The Eastern Caribbean has had a modest increase in both tropical storms and higher rated Cats relative to most of the past 170 years;
- The Western Caribbean has not been unusual at all, and, in fact, has been well below the higher counts during the 1880-1920 period;
- The Bahamas/Turks and Caicos region since 2000 has actually been well weaker than during 1930-1960 and 1880-1900.
The actual truth of the matter is that Atlantic hurricane activity is generated by atmospheric and ocean temperature conditions in the eastern Atlantic and North Africa. Those forces, in turn, are heavily influenced by the presence of an El Nino or La Nina in the Pacific Ocean. El Niño events increase the wind shear over the Atlantic, producing a less favorable environment for hurricane formation and decreasing tropical storm activity in the Atlantic basin. Conversely, La Niña causes an increase in hurricane activity due to a decrease in wind shear.
These Pacific Ocean events, of course, have never been correlated with the low level of natural global warming now underway.
 The number and strength of Atlantic hurricanes may also undergo a 50–70-year cycle known as the Atlantic Multidecadal Oscillation. Again, these cycles are unrelated to global warming trends since 1850.
Still, scientists have reconstructed Atlantic major hurricane activity back to the early 18th century (@1700) and found five periods with elevated hurricane activity averaging 3–5 major hurricanes per year and lasting 40–60 years each; and six other more quiescent periods averaging 1.5–2.5 major hurricanes per year and lasting 10–20 years each. These periods are associated with a decadal oscillation related to
solar irradiance, which is responsible for enhancing/dampening the number of major hurricanes by 1–2 per year, and clearly not a product of AGW.
Moreover, like in so many other cases the very long-term records of storm activity also rule out AGW because there was none for most of the time during the last 3,000 years, for instance. Yet according to a proxy record for that period from coastal lake sediments on Cape Cod, hurricane activity has increased significantly during the last 500-1,000 years versus earlier periods–but even that increase happened long before temperatures and carbon concentrations reached 20th-century levels.
In short, there is no reason to believe that these well understood precursor conditions and longer-term hurricane trends have been impacted by the modest increase in average global temperatures since the LIA ended in 1850.
As it happens, the same story is true with respect to wildfires like the current LA inferno. This has been the third category of natural disaster that the Climate Howlers have glommed onto. But in this case it’s the aforementioned bad forestry management, not man-made global warming, which has turned much of California into a dry wood fuel dump.
And don’t take our word for it. This quotation below comes from the George Soros-funded
Pro Publica, which is not exactly a right-wing tin foil hat outfit. It points out that environmentalists have so shackled Federal and state forest management agencies that today’s tiny “controlled burns” are but an infinitesimal fraction of what Mother Nature herself accomplished before the helping hand of today’s purportedly enlightened political authorities arrived on the scene:
Academics believe that between 4.4 million and 11.8 million acres burned each year in prehistoric California. Between 1982 and 1998, California’s agency land managers burned, on average, about 30,000 acres a year. Between 1999 and 2017, that number dropped to an annual 13,000 acres. The state passed a few new laws in 2018 designed to facilitate more intentional burning. But few are optimistic this, alone, will lead to significant change.
We live with a deathly backlog. In February 2020, Nature Sustainability published this terrifying conclusion: California would need to burn 20 million acres — an area about the size of Maine — to restabilize in terms of fire.
In short, if you don’t clear and burn out the deadwood, you build up nature-defying tinderboxes that then require only a lightning strike, a spark from an unrepaired power line, or human carelessness to ignite into a raging inferno. As one 40-year conservationist and expert summarized,
…There’s only one solution, the one we know yet still avoid. “We need to get good fire on the ground and whittle down some of that fuel load.”
More